Contents
clear; close all
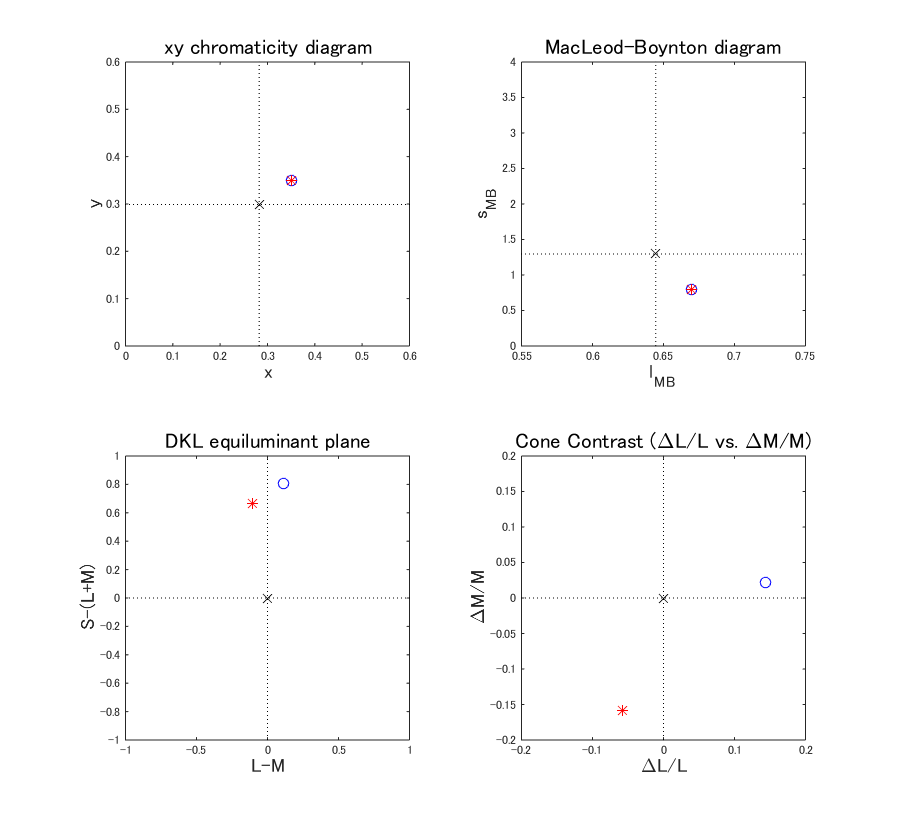
同じ刺激の座標を、異なる色空間で表示して比較する
錐体分光感度の設定
cal = LoadCalFile('PTB3TestCal');
S = cal.S_device;
whichCones = 'SmithPokorny';
[S_cones, T_cones, S_Y, T_Y] = SetFundamentals2(whichCones,S);
factors = (T_cones(1:2,:)'\T_Y');
T_cones = diag([factors ; 1])*T_cones;
計算に必要な初期設定
T_cones = SplineCmf(S_cones,T_cones,S);
cal_cones = SetSensorColorSpace(cal,T_cones,S);
cal_cones = SetGammaMethod(cal_cones,1);
cal_Lum = SetSensorColorSpace(cal,T_Y,S_Y);
bg_Primary = [0.5 0.5 0.5]';
bg_cones = PrimaryToSensor(cal_cones,bg_Primary);
M_ConeIncToDKL_Device = OurComputeDKL_M_Device(bg_cones,T_cones,T_Y,cal_cones);
s_scaler = 1 * 683;
EEW_spd = ones(S_cones(3),1);
EEW_cones = T_cones*EEW_spd;
EEW_ls = OurLMSToMacBoyn2(EEW_cones,T_cones,T_Y,s_scaler);
s_scaler = 683/EEW_ls(2);
bg_ls = OurLMSToMacBoyn2(bg_cones,T_cones,T_Y,s_scaler);
load T_xyz1931;
T_xyz = SplineCmf(S_xyz1931,683*T_xyz1931,S);
cal_XYZ = SetSensorColorSpace(cal,T_xyz,S);
bg_xyY = XYZToxyY(PrimaryToSensor(cal_XYZ,bg_Primary));
xy色度座標が等しく、輝度の異なる刺激をプロットしてみる
test1_xyY = [0.35, 0.35, 85.0]';
test2_xyY = [0.35, 0.35, 70.0]';
test1_Primary = SensorToPrimary(cal_XYZ, xyYToXYZ(test1_xyY));
test2_Primary = SensorToPrimary(cal_XYZ, xyYToXYZ(test2_xyY));
test1_cones = PrimaryToSensor(cal_cones, test1_Primary);
test2_cones = PrimaryToSensor(cal_cones, test2_Primary);
test1_ls = OurLMSToMacBoyn2(test1_cones,T_cones,T_Y,s_scaler);
test2_ls = OurLMSToMacBoyn2(test2_cones,T_cones,T_Y,s_scaler);
test1_coneInc = test1_cones - bg_cones;
test2_coneInc = test2_cones - bg_cones;
test1_dkl = M_ConeIncToDKL_Device*test1_coneInc;
test2_dkl = M_ConeIncToDKL_Device*test2_coneInc;
test1_coneContrast = test1_coneInc ./ bg_cones;
test2_coneContrast = test2_coneInc ./ bg_cones;
ourMarkerSize = 8;
figure;
subplot(2,2,1);
plot(bg_xyY(1), bg_xyY(2),'kx', 'MarkerSize',ourMarkerSize);
hold on;
plot([bg_xyY(1), bg_xyY(1)], [0,1],'k:');
plot([0, 1],[bg_xyY(2), bg_xyY(2)],'k:');
plot(test1_xyY(1), test1_xyY(2), 'bo', 'MarkerSize',ourMarkerSize);
plot(test2_xyY(1), test2_xyY(2), 'r*', 'MarkerSize',ourMarkerSize);
axis equal;
axis([0 0.6 0 0.6]);
title('xy chromaticity diagram', 'FontSize',16);
xlabel('x', 'FontSize', 14);
ylabel('y', 'FontSize', 14);
subplot(2,2,2);
plot(bg_ls(1), bg_ls(2),'kx', 'MarkerSize',ourMarkerSize);
hold on;
plot([bg_ls(1), bg_ls(1)], [0,100],'k:');
plot([0, 1],[bg_ls(2), bg_ls(2)],'k:');
plot(test1_ls(1), test1_ls(2), 'bo', 'MarkerSize',ourMarkerSize);
plot(test2_ls(1), test2_ls(2), 'r*', 'MarkerSize',ourMarkerSize);
axis([0.55 0.75 0 4]);
axis square;
title('MacLeod-Boynton diagram', 'FontSize',16);
xlabel('l_M_B', 'FontSize', 14);
ylabel('s_M_B', 'FontSize', 14);
subplot(2,2,3)
plot(0,0, 'kx', 'MarkerSize',ourMarkerSize);
hold on;
plot([0, 0], [-10,10],'k:');
plot([-10, 10],[0, 0],'k:');
plot(test1_dkl(1), test1_dkl(2), 'bo', 'MarkerSize',ourMarkerSize);
plot(test2_dkl(1), test2_dkl(2), 'r*', 'MarkerSize',ourMarkerSize);
axis([-1 1 -1 1]);
axis square;
title('DKL equiluminant plane', 'FontSize',16);
xlabel('L-M', 'FontSize', 14);
ylabel('S-(L+M)', 'FontSize', 14);
subplot(2,2,4)
plot(0,0, 'kx', 'MarkerSize',ourMarkerSize);
hold on;
plot([0, 0], [-1,1],'k:');
plot([-1, 1],[0, 0],'k:');
plot(test1_coneContrast(1), test1_coneContrast(2), 'bo', 'MarkerSize',ourMarkerSize);
plot(test2_coneContrast(1), test2_coneContrast(2), 'r*', 'MarkerSize',ourMarkerSize);
axis([-0.2 0.2 -0.2 0.2]);
axis square;
title('Cone Contrast (\DeltaL/L vs. \DeltaM/M)', 'FontSize',16);
xlabel('\DeltaL/L', 'FontSize', 14);
ylabel('\DeltaM/M', 'FontSize', 14);

